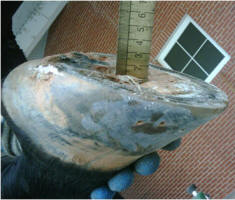
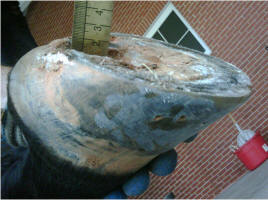
Measurements can be taken of collateral sulci depth at the back of the foot and at the apex of the frog of a live horse. These measurements have an undocumented, unproven but anecdotally consistent relationship with P3 orientation within the hoof capsule
[Fig 1- 4 pictures below] Before taking radiographs, the investigators used the CS measurements to predict 3 degree palmar angle and a 16mm sole depth
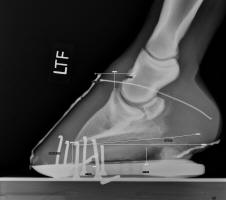
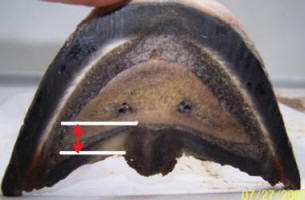
The radiograph below verified that the predictions were reasonably accurate. The accuracy of these predictions is made possible by the consistency of the externally visible collateral sulci to the third phalanx [red arrow below]
Internal Foot Development
[Fig 2 above] Lateral radiographs above of a laminitis case that was treated with the hoof rehabilitation system. Note the increase in heel depth over the 5 month treatment period. This change is a consistent finding in horses undergoing this method of hoof rehabilitation, although it has never been proven possible.
Foot 1 Foot 2 Foot 3
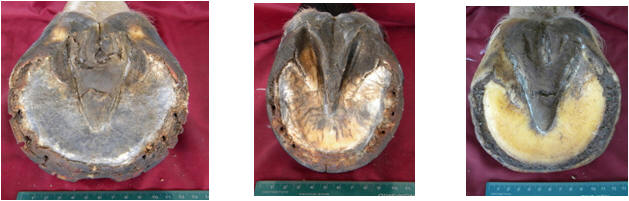
[Fig 4 above] Three equine hooves with differing external hoof capsule characteristics.
Foot 1 represents the characteristics that are often associated with the TB breed.
Foot 3 represents the characteristics that are considered healthier and is similar
to those feet that will be chosen as controls in Part II of our study.
[Fig 5] Radiographs of the same 3 feet pictured above, revealing differing palmar angles, sole depths,
and heel shapes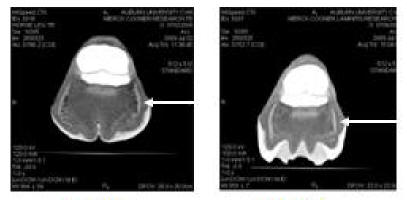
[Fig 6 above] Computed tomography image of foot 1 and foot 3,
note the differences in the shape of the heel, and the differences
in the collateral cartilages (arrow)
We hope to establish that incomplete foot development is a cause of TB hoof problems, and eventually establish that this weakness can be prevented or improved by specialized hoof care and husbandry.
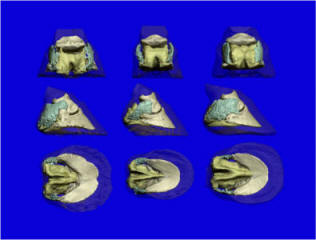
[Fig 7 above] Three dimensional computer reconstruction images of each of the three feet.
Note the differences in shape and size of the collateral cartilages (light blue),
digital cushions (tan) and P3 (white).
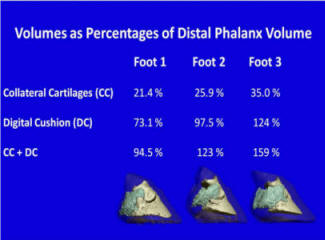
[Fig 8 above] Since each foot had a different volume P3, we compared the soft tissue volumes to P3 volume.
While statistical significance cannot be found with only 3 samples, this preliminary data warrants further investigation. 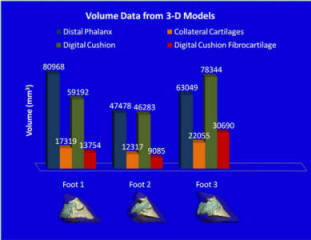
[Fig 9 above] Note that while foot 1 has a greater distal phalanx (P3) volume,
it has less collateral cartilage and digital cushion volume as well as less digital
cushion fibrocartilage when compared to foot 3.